Particle Swarm Module Homework
For the six
hump camelback function (from the earlier homework) below do the following:
1. Code a
simple full model PSO with to solve the problem. To do this you need to encode the problem as
two real variables with associated p and v vectors, and select values for Ѱ1
and Ѱ2
2. Run your
PSO for ten different seeds.
3. Vary the number of particles and Ѱ1
and Ѱ2 values with the PSO from just above (full model).
4. Draw the
convergence graph with different particles number and past it your homework
5. Please
include your code with your homework and summarize your results.
1. FONKSİYON İÇİN ÇÖZÜMLER
MATLAB
SCRİPT KODU:
function z = Pfunction(x,y)
z = (4 - 2.1*x.^2 + x.^4/3).*x.^2 + x.*y +(-4+4*y.^2).*y.^2;
end
oldGLZ=100;
for t=1:1
globalbestX = 0;
globalbestY = 0;
n=20; m=1000;
C1 = 0.5; C2 = 0.5;
fprintf('\n
C1=%d, C2=%d, İterasyon=%d \n',C1,C2,m);
seed=t;
for
i=1:n
%X(i) = rand()*5; Y(i) =
rand()*5; Vx(i) = rand()*5; Vy(i) = rand()*5;
X(i) = rand()*((rand()>0.5)*2-1)*3;
Y(i) = rand()*((rand()>0.5)*2-1)*2;
Vx(i) = 0;
Vy(i) = 0;
pbestX(i) = X(i);
pbestY(i) = Y(i);
if (Pfunction(pbestX(i),
pbestY(i))) < (Pfunction(globalbestX, globalbestY))
globalbestX = X(i); globalbestY = Y(i);
end
end
for
iteration=1:m
for i=1:n
if (Pfunction(pbestX(i),
pbestY(i)) > Pfunction(X(i), Y(i)))
pbestX(i) = X(i); pbestY(i) =
Y(i);
end
if Pfunction(pbestX(i),
pbestY(i)) < Pfunction(globalbestX, globalbestY)
globalbestX = X(i); globalbestY
= Y(i);
end
end
for
i=1:n
Vx(i) = Vx(i) + C1 * rand() * (pbestX(i) -
X(i)) + C2 * rand() * (globalbestX - X(i));
Vy(i) = Vy(i) + C1 * rand() *
(pbestY(i) - Y(i)) + C2 * rand() * (globalbestY - Y(i));
X(i) = X(i) + Vx(i); Y(i) = Y(i) +
Vy(i);
if X(i)<-3 || X(i)>3
X(i) =
rand()*((rand()>0.5)*2-1)*3;
end
if Y(i)<-2 || Y(i)>2
Y(i) =
rand()*((rand()>0.5)*2-1)*2;
end
end
GLX(iteration) = globalbestX;
GLY(iteration) = globalbestY;
GLZ(iteration) =
Pfunction(globalbestX,globalbestY);
if
GLZ(iteration)<oldGLZ
Gereken_it=iteration;
oldGLZ=GLZ;
end
end
GX = globalbestX; GY = globalbestY;
GZ = Pfunction(GX,GY);
fprintf('Seed
%d, GZ = %f, GlobalX = %f, GlobalY = %f \n',seed,GZ,GX,GY);
end
% Fonksiyon Çizimi
dx = 0.03; %Çizim
Sıklığı
Xlimits = -2:dx:2; %
Çizim X ekseni sınırları
Ylimits = -1.5:dx:1.5; %
Çizim Y ekseni sınırları
[X,Y] =
meshgrid(Xlimits,Ylimits);
Z = Pfunction(X,Y);
subplot(211);
surf(Y,X,-Z);
grid on;
xlabel('x');
ylabel('y');
zlabel('z');
hold on
%bulunan f
değerinin çizilen grafik üzerince işaretlenmesi.
subplot(211);
plot3(GY,GX,-GZ, 'b*');
it=1:1000;
subplot(212);
plot(it,GLZ),xlabel('iterasyon sayısı'), ylabel('Global_Z')
hold on;
plot(Gereken_it,GLZ(Gereken_it),'b*')
grid on;
PROGRAMIN
KOŞTURULMASI:
Örnek:1

Yakınsama
Grafiği:


Örnek:2

Yakınsama Grafiği:


10
Farklı Seed Değeri İçin Sonuçlar:

2. FONKSİYON İÇİN ÇÖZÜMLER
MATLAB SCRİPT KODU:
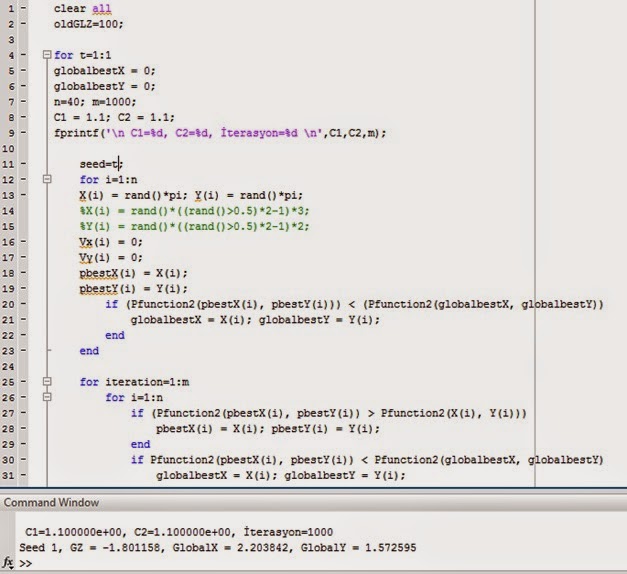
function z = Pfunction2(x,y)
z=-( (sin(x) .* (sin((1 * x.^2)/pi)).^20) + (sin(y) .* (sin((2 * y.^2)/pi)).^20) );
end
oldGLZ=100;
for t=1:10
globalbestX = 0;
globalbestY = 0;
n=40; m=1000;
C1 = 1.1; C2 = 1.1;
fprintf('\n
C1=%d, C2=%d, İterasyon=%d \n',C1,C2,m);
seed=t;
for
i=1:n
X(i) = rand()*pi; Y(i) = rand()*pi;
%X(i) =
rand()*((rand()>0.5)*2-1)*3;
%Y(i) =
rand()*((rand()>0.5)*2-1)*2;
Vx(i) = 0;
Vy(i) = 0;
pbestX(i) = X(i);
pbestY(i) = Y(i);
if (Pfunction2(pbestX(i),
pbestY(i))) < (Pfunction2(globalbestX, globalbestY))
globalbestX = X(i); globalbestY =
Y(i);
end
end
for
iteration=1:m
for i=1:n
if (Pfunction2(pbestX(i),
pbestY(i)) > Pfunction2(X(i), Y(i)))
pbestX(i) = X(i); pbestY(i) =
Y(i);
end
if Pfunction2(pbestX(i),
pbestY(i)) < Pfunction2(globalbestX, globalbestY)
globalbestX = X(i); globalbestY
= Y(i);
end
end
for
i=1:n
Vx(i) = Vx(i) + C1 * rand() *
(pbestX(i) - X(i)) + C2 * rand() * (globalbestX - X(i));
Vy(i) = Vy(i) + C1 * rand() *
(pbestY(i) - Y(i)) + C2 * rand() * (globalbestY - Y(i));
X(i) = X(i) + Vx(i); Y(i) = Y(i) +
Vy(i);
if X(i)<0 || X(i)>pi
X(i)= rand()*pi;
end
if Y(i)<0 || Y(i)>pi
Y(i)= rand()*pi;
end
end
GLX(iteration) = globalbestX;
GLY(iteration) = globalbestY;
GLZ(iteration) =
Pfunction2(globalbestX,globalbestY);
if
GLZ(iteration)<oldGLZ
Gereken_it=iteration;
oldGLZ=GLZ;
end
end
GX = globalbestX; GY = globalbestY;
GZ = Pfunction2(GX,GY);
fprintf('Seed
%d, GZ = %f, GlobalX = %f, GlobalY = %f \n',seed,GZ,GX,GY);
end
%fonksiyonun
çizdirilmesi
[x,y]=meshgrid(0:.03:pi,0:.03:pi);
z=Pfunction2(x,y);
subplot(211);
surf(x,y,z);
hold on
%bulunan f
değerinin çizilen grafik üzerince işaretlenmesi.
subplot(211);
plot3(GX,GY,GZ, 'b*');
it=1:1000;
subplot(212);
plot(it,GLZ),xlabel('iterasyon sayısı'), ylabel('Global_Z')
hold on;
plot(Gereken_it,GLZ(Gereken_it),'b*')
grid on;
PROGRAMIN
KOŞTURULMASI:
Örnek:1
Yakınsama Grafiği:

Örnek:2

Yakınsama Grafiği:

10 Farklı Seed Değeri İçin Sonuçlar:

Hiç yorum yok:
Yorum Gönder